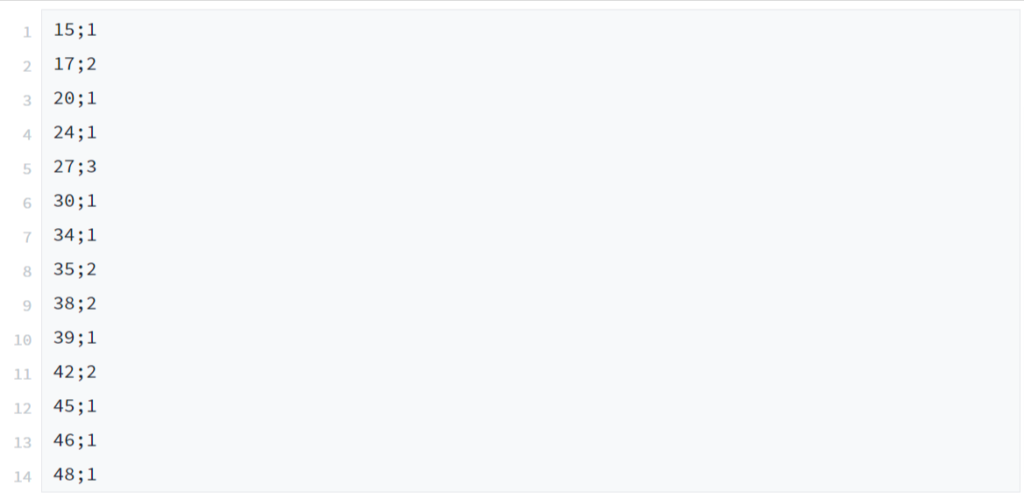
Historical data of completed tasks must be delivered to the application as a CSV file in this format:
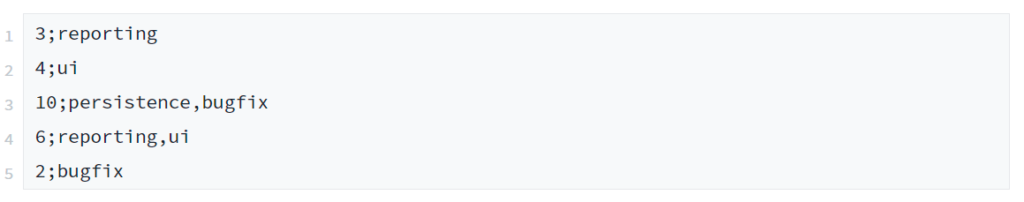
Each line contains the effort required to complete the task. The number is an integer and its unit depends on the user. It can be days, hours, minutes, whatever - as long as the unit is the same for all data.
Each effort can optionally be assigned one or more categories to which it belongs.
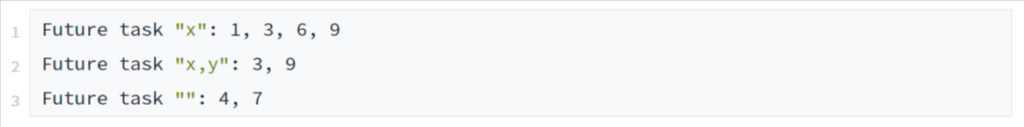
A forecast is requested by entering a series of future tasks that need to be completed. Each task can be labeled with a number of categories that can be found in the historical data, e.g.
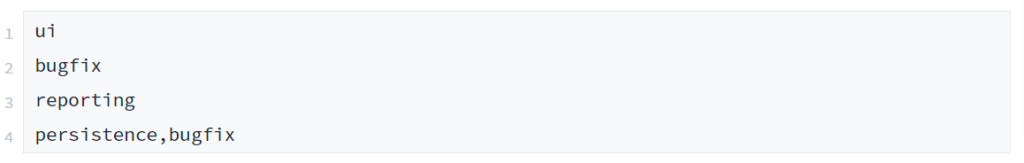
If more than one future task belongs to the same category mix, this could be indicated with a multiplier, e.g.

How the future tasks are entered is up to you. Choose a console, GUI or web user interface as you wish.
The point of this approach is not to burden developers with estimates. Rather, they should simply be asked to assign future tasks to categories. This should be very simple.
Given a set of future tasks and a long list of historical data, a forecast is calculated by simulating the execution of the future tasks by selecting their efforts from the historical data. Example:
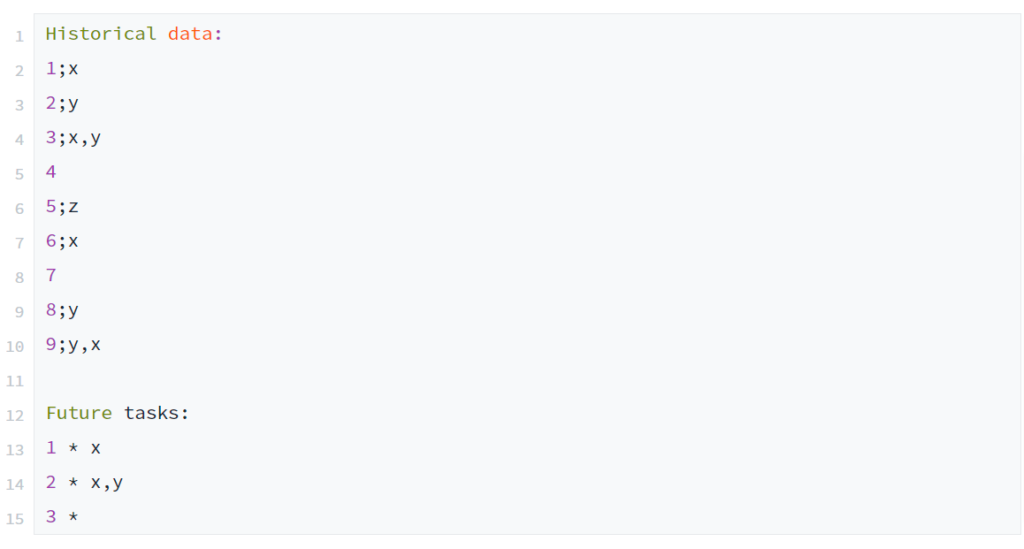
Suitable historical data is collected in advance of a simulation, e.g.
A random (!) effort is then selected from these options to determine how often a future task with these categories is planned:
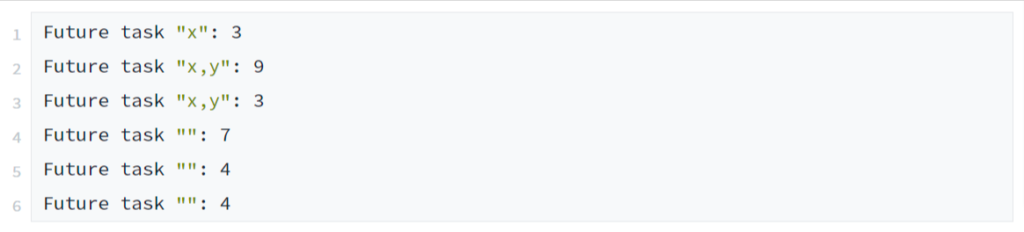
Finally, the efforts are added up to a simulated total effort, e.g.

This can now be repeated 10, 100, 1000 or 5000 times. The result is a large set of potential total expenses from historical data.
The premise behind this: Future tasks require just as much effort as completed tasks. The more historical data you can enter, the better the assignment to categories and the better the forecast.
This is known as a Monte Carlo simulation. This is because the data taken into account for each simulation run is selected at random.
But what do 1000 or more potential total efforts mean? How long will it take to complete the future tasks? Isn't every simulation equally likely?
Even if this is true, there will be clusters of total expenditures and follow a distribution that is hidden in the historical data. To reach a conclusion, it is necessary to base decisions on a final step.
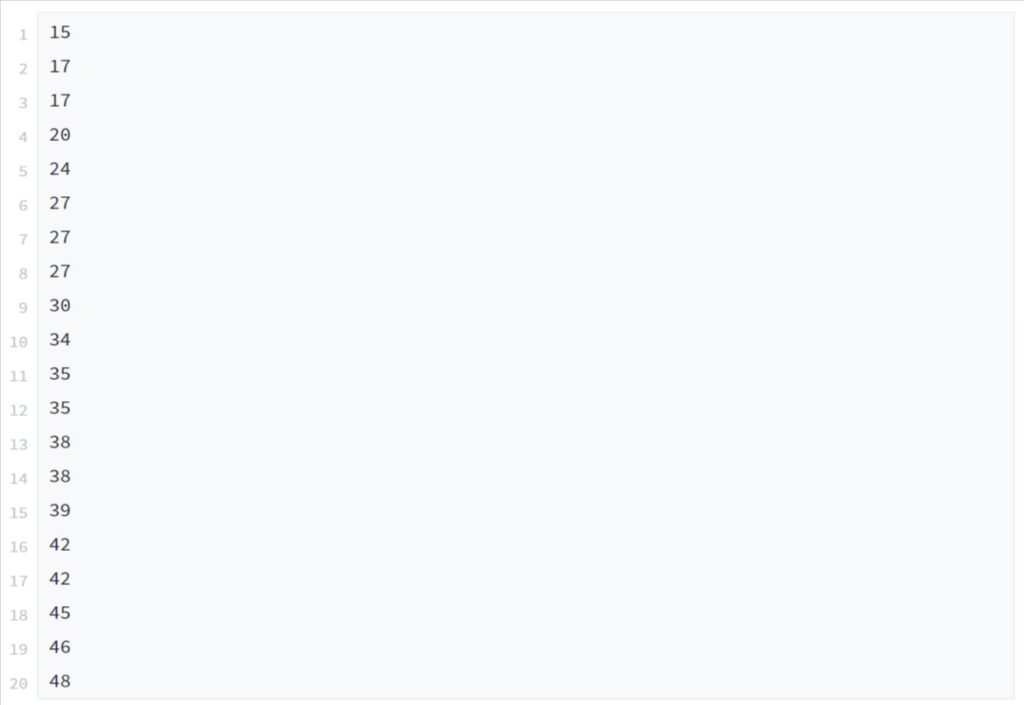
First sort all simulation results, e.g.
Then break down the results according to the risks you want to take. For example, you could ask what is the total effort that represents a 50-% risk of failure, or a risk of 30 %, or a risk of 0 %? The program could ask for these risk levels or simply output the risks in 10 % increments, e.g.
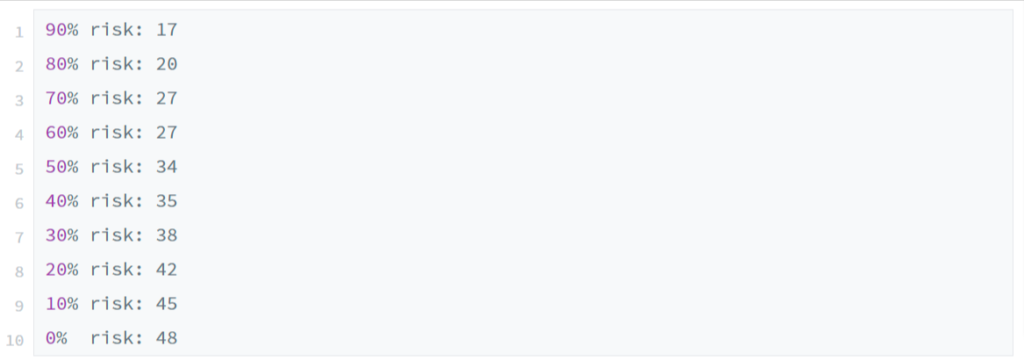
If future task efforts are distributed like completed task efforts, it takes no longer than 48 time units. This is the safest number to implement. However, if a manager is willing to take a certain risk, he could select 38 time units and accept a 30 percent chance that the budget will not be met. At least according to 20 simulations based on historical data.
The expected total expenditure for a specific risk (e.g. 80%) is taken from the sorted list by looking up the simulation result under Index (100-risk)/100*number of simulations, e.g.

WARNING: Every forecast is just that, a forecast, i.e. a possible result, but not a promise. Even a 0% effort can be exceeded in reality. It's like gambling. Just because you've won several times when rolling the dice doesn't mean you'll win again. It's all a matter of chance, i.e. it all depends on the distribution of values. And of course, it also depends on who exactly you measure and tag and how you divide up requirements to arrive at tasks in the first place.
Nevertheless, this approach holds many promises. It takes the pressure off developers, makes forecasts very quickly and offers a range of values with different risks.
The output of the application should be a forecast as above and a list of future tasks entered to document what has been understood as the simulation basis.
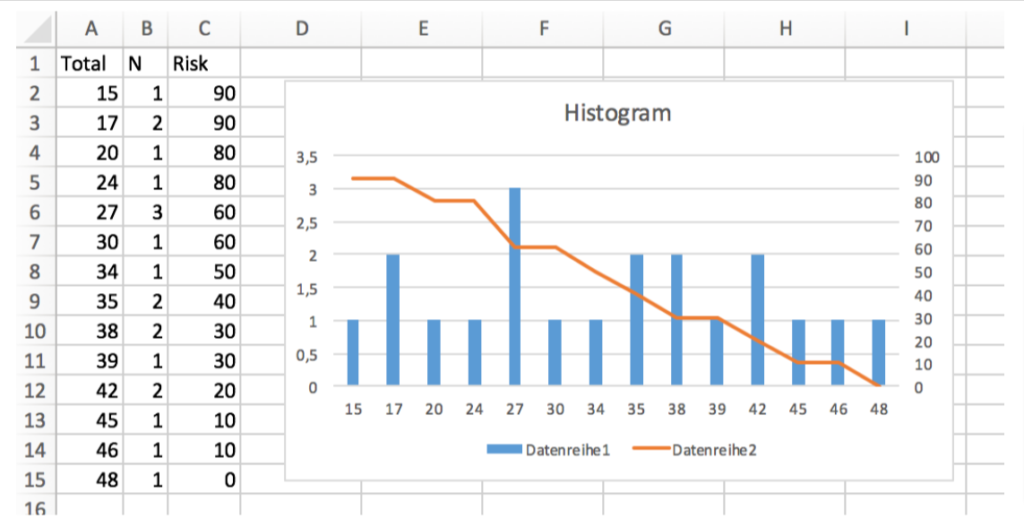
In addition, a file with compressed simulation results could be written to draw a histogram with Excel, e.g.
Or perhaps even add risks to the histogram file so that two graphs can be displayed: one for the distribution of simulated effort (bar) and one for the associated risk (line):